Power Apps
Getting Started with Code Apps: Build an Interactive Dashboard
A step-by-step tutorial to build and deploy an interactive KPI dashboard as a Power Apps Code App with React, TypeScript, and Recharts.
This is a hands-on tutorial. By the end, you will have a fully interactive executive dashboard running inside Power Platform, complete with animated counters, charts, filters, and dark mode. No prior Code Apps experience required, just React/TypeScript fundamentals and a Power Platform environment.
What you will build
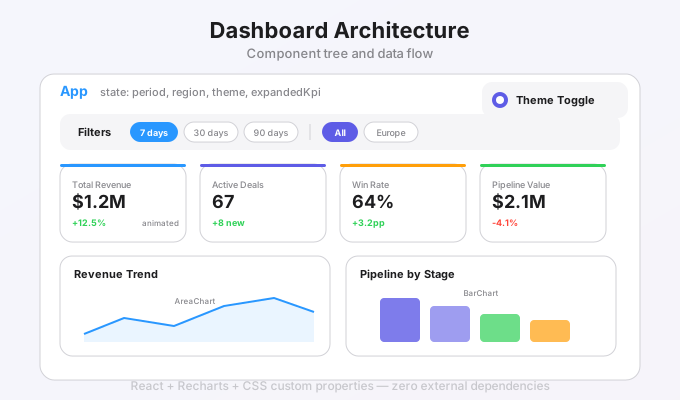
An executive KPI dashboard with:
- 4 animated KPI cards that count up on load and re-animate when filters change
- Period filters (7 days / 30 days / 90 days / 1 year)
- Region filters (All / Europe / Americas / Asia-Pacific)
- Revenue trend chart (area chart) and Pipeline by stage (bar chart)
- Top deals table with stage badges and probability bars
- Dark/Light mode toggle with smooth transitions
- Toast notifications on every filter change
All client-side with embedded sample data: zero connector setup required.
Try it live
This is the actual app running below: click the filters, toggle dark mode, expand the KPI cards:
The interactive demo is not run inside this article. The original explanation and code are retained below.
Open the standalone dashboard demo — fictional data only; no account or external connection.
Prerequisites
Before starting, make sure you have:
- Node.js LTS installed (nodejs.org)
- Visual Studio Code or any editor
- Power Platform CLI (
pac): install instructions - A Power Platform environment with Code Apps enabled
- An authenticated PAC CLI session (
pac auth create)
Step 1: Scaffold the project
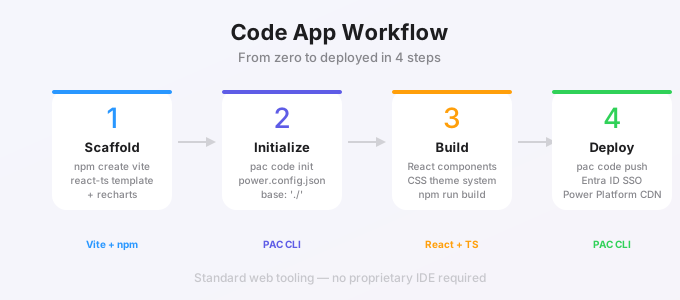
Create a Vite + React + TypeScript project and install Recharts for the charts:
npm create vite@latest code-app-dashboard -- --template react-ts
cd code-app-dashboard
npm install
npm install recharts
Step 2: Initialize the Code App
Register the project as a Power Apps Code App:
pac code init \
  --displayName "Executive Dashboard" \
  --description "Interactive KPI Dashboard built with React"
This creates power.config.json, the metadata file that links your project to Power Platform.
Replace the content of vite.config.ts with:
// vite.config.ts
import { defineConfig } from 'vite'
import react from '@vitejs/plugin-react'

export default defineConfig({
  plugins: [react()],
  base: './',
})
Step 3: Set up the theme system
Create src/theme.ts. This file defines light and dark token sets as plain JavaScript objects, then applies them to CSS custom properties on the document root. When the theme toggles, every component that uses var(--accent), var(--bg-card), etc. transitions automatically: no CSS-in-JS library needed.
// src/theme.ts
export const lightTheme: Record<string, string> = {
  '--bg-primary': '#f8f9fc',
  '--bg-card': '#ffffff',
  '--bg-card-hover': '#f3f0ff',
  '--text-primary': '#1a1a2e',
  '--text-secondary': '#6b7280',
  '--text-muted': '#9ca3af',
  '--border': '#e5e7eb',
  '--accent': '#7c3aed',
  '--accent-light': '#ede9fe',
  '--accent-gradient': 'linear-gradient(135deg, #7c3aed 0%, #a78bfa 100%)',
  '--success': '#10b981',
  '--success-bg': '#ecfdf5',
  '--warning': '#f59e0b',
  '--warning-bg': '#fffbeb',
  '--danger': '#ef4444',
  '--danger-bg': '#fef2f2',
  '--shadow-sm': '0 1px 3px rgba(0,0,0,0.08)',
  '--shadow-md': '0 4px 12px rgba(0,0,0,0.08)',
  '--shadow-lg': '0 8px 30px rgba(0,0,0,0.1)',
};

export const darkTheme: Record<string, string> = {
  '--bg-primary': '#0f0f1a',
  '--bg-card': '#1a1a2e',
  '--bg-card-hover': '#252540',
  '--text-primary': '#e5e7eb',
  '--text-secondary': '#9ca3af',
  '--text-muted': '#6b7280',
  '--border': '#2d2d44',
  '--accent': '#a78bfa',
  '--accent-light': '#1e1b3a',
  '--accent-gradient': 'linear-gradient(135deg, #7c3aed 0%, #a78bfa 100%)',
  '--success': '#34d399',
  '--success-bg': '#0a2e1f',
  '--warning': '#fbbf24',
  '--warning-bg': '#2e2205',
  '--danger': '#f87171',
  '--danger-bg': '#2e0a0a',
  '--shadow-sm': '0 1px 3px rgba(0,0,0,0.3)',
  '--shadow-md': '0 4px 12px rgba(0,0,0,0.3)',
  '--shadow-lg': '0 8px 30px rgba(0,0,0,0.4)',
};

export function applyTheme(theme: Record<string, string>) {
  const root = document.documentElement;
  Object.entries(theme).forEach(([key, value]) => {
    root.style.setProperty(key, value);
  });
}
Step 4: Create the data module
Create src/data.ts. This is the full file: every value is indexed by [region][period] so that changing any filter immediately maps to the right number. The chart generator functions apply a regional multiplier to the base data so you don't need to duplicate arrays for each region.
In a real app, this is where you would call Dataverse or any connector. For this tutorial, embedded data keeps things dependency-free.
// src/data.ts
export interface KPI {
  id: string;
  label: string;
  icon: string;
  format: 'currency' | 'number' | 'percent';
  trend: 'up' | 'down';
  trendLabel: string;
  values: Record<string, Record<string, number>>;
}

export interface DealRow {
  name: string;
  company: string;
  value: number;
  stage: string;
  region: string;
  probability: number;
}

export interface ChartPoint {
  name: string;
  value: number;
}

export type Period = '7d' | '30d' | '90d' | '1y';
export type Region = 'all' | 'europe' | 'americas' | 'asia';

export const PERIODS: { key: Period; label: string }[] = [
  { key: '7d', label: '7 days' },
  { key: '30d', label: '30 days' },
  { key: '90d', label: '90 days' },
  { key: '1y', label: '1 year' },
];

export const REGIONS: { key: Region; label: string }[] = [
  { key: 'all', label: 'All Regions' },
  { key: 'europe', label: 'Europe' },
  { key: 'americas', label: 'Americas' },
  { key: 'asia', label: 'Asia-Pacific' },
];

export const KPI_DATA: KPI[] = [
  {
    id: 'revenue',
    label: 'Total Revenue',
    icon: '\u{1F4B0}',
    format: 'currency',
    trend: 'up',
    trendLabel: '+12.5%',
    values: {
      all:      { '7d': 284000, '30d': 1240000, '90d': 3820000, '1y': 15400000 },
      europe:   { '7d': 112000, '30d': 496000, '90d': 1528000, '1y': 6160000 },
      americas: { '7d': 125000, '30d': 546000, '90d': 1681000, '1y': 6776000 },
      asia:     { '7d': 47000, '30d': 198000, '90d': 611000, '1y': 2464000 },
    },
  },
  {
    id: 'deals',
    label: 'Active Deals',
    icon: '\u{1F4C8}',
    format: 'number',
    trend: 'up',
    trendLabel: '+8 new',
    values: {
      all:      { '7d': 24, '30d': 67, '90d': 142, '1y': 389 },
      europe:   { '7d': 9, '30d': 26, '90d': 55, '1y': 152 },
      americas: { '7d': 11, '30d': 30, '90d': 63, '1y': 170 },
      asia:     { '7d': 4, '30d': 11, '90d': 24, '1y': 67 },
    },
  },
  {
    id: 'winrate',
    label: 'Win Rate',
    icon: '\u{1F3AF}',
    format: 'percent',
    trend: 'up',
    trendLabel: '+3.2pp',
    values: {
      all:      { '7d': 68, '30d': 64, '90d': 61, '1y': 58 },
      europe:   { '7d': 72, '30d': 67, '90d': 63, '1y': 60 },
      americas: { '7d': 65, '30d': 62, '90d': 59, '1y': 56 },
      asia:     { '7d': 64, '30d': 60, '90d': 58, '1y': 55 },
    },
  },
  {
    id: 'pipeline',
    label: 'Pipeline Value',
    icon: '\u{1F680}',
    format: 'currency',
    trend: 'down',
    trendLabel: '-4.1%',
    values: {
      all:      { '7d': 520000, '30d': 2100000, '90d': 6400000, '1y': 24800000 },
      europe:   { '7d': 208000, '30d': 840000, '90d': 2560000, '1y': 9920000 },
      americas: { '7d': 228000, '30d': 924000, '90d': 2816000, '1y': 10912000 },
      asia:     { '7d': 84000, '30d': 336000, '90d': 1024000, '1y': 3968000 },
    },
  },
];

export function getRevenueChart(period: Period, region: Region): ChartPoint[] {
  const base: Record<string, ChartPoint[]> = {
    '7d': [
      { name: 'Mon', value: 38000 }, { name: 'Tue', value: 42000 }, { name: 'Wed', value: 35000 },
      { name: 'Thu', value: 48000 }, { name: 'Fri', value: 52000 }, { name: 'Sat', value: 31000 },
      { name: 'Sun', value: 38000 },
    ],
    '30d': [
      { name: 'W1', value: 280000 }, { name: 'W2', value: 310000 },
      { name: 'W3', value: 295000 }, { name: 'W4', value: 355000 },
    ],
    '90d': [
      { name: 'Jan', value: 1100000 }, { name: 'Feb', value: 1280000 }, { name: 'Mar', value: 1440000 },
    ],
    '1y': [
      { name: 'Q1', value: 3200000 }, { name: 'Q2', value: 3600000 },
      { name: 'Q3', value: 4100000 }, { name: 'Q4', value: 4500000 },
    ],
  };
  const multiplier =
    region === 'all' ? 1 :
    region === 'americas' ? 0.44 :
    region === 'europe' ? 0.40 : 0.16;
  return (base[period] || base['30d']).map(p => ({ ...p, value: Math.round(p.value * multiplier) }));
}

export function getPipelineByStage(region: Region): ChartPoint[] {
  const multiplier =
    region === 'all' ? 1 :
    region === 'americas' ? 0.44 :
    region === 'europe' ? 0.40 : 0.16;
  return [
    { name: 'Discovery', value: Math.round(840000 * multiplier) },
    { name: 'Proposal', value: Math.round(620000 * multiplier) },
    { name: 'Negotiation', value: Math.round(380000 * multiplier) },
    { name: 'Closing', value: Math.round(260000 * multiplier) },
  ];
}

export function getTopDeals(region: Region): DealRow[] {
  const deals: DealRow[] = [
    { name: 'Cloud Migration', company: 'Contoso Ltd', value: 450000, stage: 'Negotiation', region: 'europe', probability: 75 },
    { name: 'ERP Upgrade', company: 'Fabrikam Inc', value: 380000, stage: 'Proposal', region: 'americas', probability: 60 },
    { name: 'Data Platform', company: 'Northwind Traders', value: 320000, stage: 'Closing', region: 'europe', probability: 90 },
    { name: 'Security Audit', company: 'Adventure Works', value: 180000, stage: 'Discovery', region: 'americas', probability: 40 },
    { name: 'AI Integration', company: 'Tailspin Toys', value: 520000, stage: 'Proposal', region: 'asia', probability: 55 },
    { name: 'Digital Twin', company: 'Woodgrove Bank', value: 680000, stage: 'Negotiation', region: 'americas', probability: 70 },
    { name: 'IoT Platform', company: 'Litware Inc', value: 290000, stage: 'Closing', region: 'europe', probability: 85 },
    { name: 'Analytics Suite', company: 'Proseware', value: 410000, stage: 'Discovery', region: 'asia', probability: 35 },
  ];
  if (region === 'all') return deals;
  return deals.filter(d => d.region === region);
}
Step 5: Build the dashboard
Create src/App.tsx. The file is shown in full below so you can copy it directly. Key patterns are explained after the code block.
// src/App.tsx
import { useState, useEffect, useCallback, useRef } from 'react';
import {
  BarChart, Bar, AreaChart, Area, XAxis, YAxis, Tooltip, ResponsiveContainer, Cell,
} from 'recharts';
import {
  KPI_DATA, PERIODS, REGIONS, getRevenueChart, getPipelineByStage, getTopDeals,
  type Period, type Region, type KPI,
} from './data';
import { lightTheme, darkTheme, applyTheme } from './theme';
import './styles.css';

/* ── Animated Counter Hook ── */
function useAnimatedValue(target: number, duration = 800) {
  const [value, setValue] = useState(0);
  const rafRef = useRef<number>(0);

  useEffect(() => {
    const start = value;
    const diff = target - start;
    const startTime = performance.now();

    function tick(now: number) {
      const elapsed = now - startTime;
      const progress = Math.min(elapsed / duration, 1);
      const eased = 1 - Math.pow(1 - progress, 3); // easeOutCubic
      setValue(Math.round(start + diff * eased));
      if (progress < 1) rafRef.current = requestAnimationFrame(tick);
    }

    rafRef.current = requestAnimationFrame(tick);
    return () => cancelAnimationFrame(rafRef.current);
    // eslint-disable-next-line react-hooks/exhaustive-deps
  }, [target, duration]);

  return value;
}

/* ── Format Helpers ── */
function formatValue(n: number, format: KPI['format']) {
  if (format === 'currency') {
    if (n >= 1_000_000) return `$${(n / 1_000_000).toFixed(1)}M`;
    if (n >= 1_000) return `$${(n / 1_000).toFixed(0)}K`;
    return `$${n}`;
  }
  if (format === 'percent') return `${n}%`;
  return n.toLocaleString();
}

function formatCurrency(n: number) {
  if (n >= 1_000_000) return `$${(n / 1_000_000).toFixed(1)}M`;
  if (n >= 1_000) return `$${(n / 1_000).toFixed(0)}K`;
  return `$${n}`;
}

/* ── KPI Card Component ── */
function KpiCard({ kpi, period, region, expanded, onToggle }: {
  kpi: KPI; period: Period; region: Region; expanded: boolean; onToggle: () => void;
}) {
  const raw = kpi.values[region]?.[period] ?? kpi.values['all'][period];
  const animated = useAnimatedValue(raw);
  const allPeriods = (['7d', '30d', '90d', '1y'] as Period[]).filter(p => p !== period);

  return (
    <div className={`kpi-card${expanded ? ' expanded' : ''}`} onClick={onToggle}>
      <div className="kpi-header">
        <span className="kpi-label">{kpi.label}</span>
        <span className="kpi-icon">{kpi.icon}</span>
      </div>
      <div className="kpi-value" key={`${region}-${period}`}>
        {formatValue(animated, kpi.format)}
      </div>
      <span className={`kpi-trend ${kpi.trend}`}>
        {kpi.trend === 'up' ? '\u2191' : '\u2193'} {kpi.trendLabel}
      </span>
      {expanded && (
        <div className="kpi-detail">
          {allPeriods.map(p => (
            <div className="kpi-detail-row" key={p}>
              <span>{PERIODS.find(x => x.key === p)?.label}</span>
              <span>{formatValue(kpi.values[region]?.[p] ?? kpi.values['all'][p], kpi.format)}</span>
            </div>
          ))}
        </div>
      )}
    </div>
  );
}

/* ── Custom Tooltip ── */
function ChartTooltip({ active, payload, label }: {
  active?: boolean; payload?: { value: number }[]; label?: string;
}) {
  if (!active || !payload?.length) return null;
  return (
    <div style={{
      background: 'var(--bg-card)', border: '1px solid var(--border)',
      borderRadius: 10, padding: '0.5rem 0.75rem', boxShadow: 'var(--shadow-md)',
    }}>
      <div style={{ fontSize: '0.75rem', color: 'var(--text-muted)' }}>{label}</div>
      <div style={{ fontSize: '0.95rem', fontWeight: 700, color: 'var(--text-primary)' }}>
        {formatCurrency(payload[0].value)}
      </div>
    </div>
  );
}

/* ── Main App ── */
export default function App() {
  const [dark, setDark] = useState(false);
  const [period, setPeriod] = useState<Period>('30d');
  const [region, setRegion] = useState<Region>('all');
  const [expandedKpi, setExpandedKpi] = useState<string | null>(null);
  const [toast, setToast] = useState<string | null>(null);

  useEffect(() => {
    applyTheme(dark ? darkTheme : lightTheme);
  }, [dark]);

  const showToast = useCallback((msg: string) => {
    setToast(msg);
    setTimeout(() => setToast(null), 2000);
  }, []);

  const handlePeriod = (p: Period) => {
    setPeriod(p);
    showToast(`Showing ${PERIODS.find(x => x.key === p)?.label} data`);
  };

  const handleRegion = (r: Region) => {
    setRegion(r);
    showToast(`Filtered: ${REGIONS.find(x => x.key === r)?.label}`);
  };

  const revenueData = getRevenueChart(period, region);
  const pipelineData = getPipelineByStage(region);
  const deals = getTopDeals(region);
  const barColors = ['#7c3aed', '#a78bfa', '#10b981', '#f59e0b'];

  return (
    <div className="dashboard">
      {/* Header */}
      <div className="header">
        <h1>Executive Dashboard</h1>
        <div className="header-actions">
          <button
            className={`theme-toggle${dark ? ' dark' : ''}`}
            onClick={() => setDark(d => !d)}
            title={dark ? 'Switch to light mode' : 'Switch to dark mode'}
            aria-label="Toggle theme"
          />
        </div>
      </div>

      {/* Period + Region Filters */}
      <div className="filters">
        {PERIODS.map(p => (
          <button
            key={p.key}
            className={`pill${period === p.key ? ' active' : ''}`}
            onClick={() => handlePeriod(p.key)}
          >
            {p.label}
          </button>
        ))}
        <span style={{ width: 1, background: 'var(--border)', margin: '0 0.25rem' }} />
        {REGIONS.map(r => (
          <button
            key={r.key}
            className={`pill${region === r.key ? ' active' : ''}`}
            onClick={() => handleRegion(r.key)}
          >
            {r.label}
          </button>
        ))}
      </div>

      {/* KPI Cards */}
      <div className="kpi-grid">
        {KPI_DATA.map(kpi => (
          <KpiCard
            key={kpi.id}
            kpi={kpi}
            period={period}
            region={region}
            expanded={expandedKpi === kpi.id}
            onToggle={() => setExpandedKpi(prev => prev === kpi.id ? null : kpi.id)}
          />
        ))}
      </div>

      {/* Charts */}
      <div className="charts-grid">
        <div className="chart-card">
          <h3>Revenue Trend</h3>
          <ResponsiveContainer width="100%" height={240}>
            <AreaChart data={revenueData}>
              <defs>
                <linearGradient id="areaGrad" x1="0" y1="0" x2="0" y2="1">
                  <stop offset="0%" stopColor="#7c3aed" stopOpacity={0.3} />
                  <stop offset="100%" stopColor="#7c3aed" stopOpacity={0} />
                </linearGradient>
              </defs>
              <XAxis dataKey="name" axisLine={false} tickLine={false}
                tick={{ fill: 'var(--text-muted)', fontSize: 12 }} />
              <YAxis hide />
              <Tooltip content={<ChartTooltip />} />
              <Area type="monotone" dataKey="value" stroke="#7c3aed"
                strokeWidth={2.5} fill="url(#areaGrad)" animationDuration={800} />
            </AreaChart>
          </ResponsiveContainer>
        </div>

        <div className="chart-card">
          <h3>Pipeline by Stage</h3>
          <ResponsiveContainer width="100%" height={240}>
            <BarChart data={pipelineData} barCategoryGap="25%">
              <XAxis dataKey="name" axisLine={false} tickLine={false}
                tick={{ fill: 'var(--text-muted)', fontSize: 12 }} />
              <YAxis hide />
              <Tooltip content={<ChartTooltip />} />
              <Bar dataKey="value" radius={[8, 8, 0, 0]} animationDuration={800}>
                {pipelineData.map((_, i) => (
                  <Cell key={i} fill={barColors[i % barColors.length]} />
                ))}
              </Bar>
            </BarChart>
          </ResponsiveContainer>
        </div>
      </div>

      {/* Deals Table */}
      <div className="deals-card">
        <h3>Top Deals</h3>
        <table className="deals-table">
          <thead>
            <tr>
              <th>Deal</th>
              <th>Value</th>
              <th>Stage</th>
              <th>Probability</th>
            </tr>
          </thead>
          <tbody>
            {deals.map(d => (
              <tr key={d.name}>
                <td>
                  <div style={{ fontWeight: 600 }}>{d.name}</div>
                  <div className="company">{d.company}</div>
                </td>
                <td style={{ fontWeight: 600, fontVariantNumeric: 'tabular-nums' }}>
                  {formatCurrency(d.value)}
                </td>
                <td>
                  <span className={`stage-badge ${d.stage.toLowerCase()}`}>{d.stage}</span>
                </td>
                <td>
                  <span className="prob-bar-bg">
                    <span className="prob-bar" style={{ width: `${d.probability}%` }} />
                  </span>
                  {d.probability}%
                </td>
              </tr>
            ))}
          </tbody>
        </table>
      </div>

      {/* Footer */}
      <div className="footer">
        Built with React + Recharts — Powered by Power Apps Code Apps
      </div>

      {/* Toast */}
      <div className={`toast${toast ? ' visible' : ''}`}>{toast}</div>
    </div>
  );
}
Key patterns in the code above:
useAnimatedValueis a custom hook that usesrequestAnimationFramewith an easeOutCubic easing function: it counts from the current displayed value to the new target, so filter changes animate smoothly without resetting to zero.KpiCardis stateless: it receivesexpandedandonTogglefrom the parent. Clicking a card expands it to show all period values for the current region.ChartTooltiprenders using CSS variables directly in thestyleprop, so it inherits the active theme automatically.- The toast system uses a
setTimeoutto clear the message: simple and effective without needing a library.
Step 6: Add the styles
Create src/styles.css. This is the full file:
/* ── Reset & Base ── */
*, *::before, *::after { box-sizing: border-box; margin: 0; padding: 0; }

:root {
  --bg-primary: #f8f9fc;
  --bg-card: #ffffff;
  --bg-card-hover: #f3f0ff;
  --text-primary: #1a1a2e;
  --text-secondary: #6b7280;
  --text-muted: #9ca3af;
  --border: #e5e7eb;
  --accent: #7c3aed;
  --accent-light: #ede9fe;
  --accent-gradient: linear-gradient(135deg, #7c3aed 0%, #a78bfa 100%);
  --success: #10b981;
  --success-bg: #ecfdf5;
  --warning: #f59e0b;
  --warning-bg: #fffbeb;
  --danger: #ef4444;
  --danger-bg: #fef2f2;
  --shadow-sm: 0 1px 3px rgba(0,0,0,0.08);
  --shadow-md: 0 4px 12px rgba(0,0,0,0.08);
  --shadow-lg: 0 8px 30px rgba(0,0,0,0.1);
}

body {
  font-family: 'Segoe UI', -apple-system, BlinkMacSystemFont, sans-serif;
  background: var(--bg-primary);
  color: var(--text-primary);
  line-height: 1.5;
  transition: background 0.3s ease, color 0.3s ease;
}

/* ── Layout ── */
.dashboard {
  max-width: 1200px;
  margin: 0 auto;
  padding: 2rem 1.5rem;
}

.header {
  display: flex;
  align-items: center;
  justify-content: space-between;
  margin-bottom: 2rem;
  flex-wrap: wrap;
  gap: 1rem;
}

.header h1 {
  font-size: 1.75rem;
  font-weight: 700;
  background: var(--accent-gradient);
  -webkit-background-clip: text;
  -webkit-text-fill-color: transparent;
  background-clip: text;
}

.header-actions {
  display: flex;
  align-items: center;
  gap: 0.75rem;
}

/* ── Toggle Button ── */
.theme-toggle {
  width: 44px;
  height: 24px;
  border-radius: 12px;
  border: 2px solid var(--border);
  background: var(--bg-card);
  cursor: pointer;
  position: relative;
  transition: all 0.3s ease;
}

.theme-toggle::after {
  content: '';
  position: absolute;
  width: 16px;
  height: 16px;
  border-radius: 50%;
  background: var(--accent);
  top: 2px;
  left: 2px;
  transition: transform 0.3s ease;
}

.theme-toggle.dark::after {
  transform: translateX(20px);
}

/* ── Filter Pills ── */
.filters {
  display: flex;
  gap: 0.5rem;
  flex-wrap: wrap;
  margin-bottom: 1.5rem;
}

.pill {
  padding: 0.5rem 1rem;
  border-radius: 9999px;
  border: 1.5px solid var(--border);
  background: var(--bg-card);
  color: var(--text-secondary);
  font-size: 0.85rem;
  font-weight: 500;
  cursor: pointer;
  transition: all 0.2s ease;
  user-select: none;
}

.pill:hover {
  border-color: var(--accent);
  color: var(--accent);
}

.pill.active {
  background: var(--accent);
  border-color: var(--accent);
  color: white;
}

/* ── KPI Cards ── */
.kpi-grid {
  display: grid;
  grid-template-columns: repeat(auto-fit, minmax(240px, 1fr));
  gap: 1rem;
  margin-bottom: 2rem;
}

.kpi-card {
  background: var(--bg-card);
  border: 1px solid var(--border);
  border-radius: 16px;
  padding: 1.5rem;
  box-shadow: var(--shadow-sm);
  cursor: pointer;
  transition: all 0.3s ease;
  position: relative;
  overflow: hidden;
}

.kpi-card::before {
  content: '';
  position: absolute;
  top: 0;
  left: 0;
  right: 0;
  height: 3px;
  background: var(--accent-gradient);
  opacity: 0;
  transition: opacity 0.3s ease;
}

.kpi-card:hover {
  transform: translateY(-2px);
  box-shadow: var(--shadow-md);
  border-color: var(--accent);
}

.kpi-card:hover::before { opacity: 1; }

.kpi-card.expanded {
  grid-column: 1 / -1;
}

.kpi-header {
  display: flex;
  align-items: center;
  justify-content: space-between;
  margin-bottom: 0.75rem;
}

.kpi-icon { font-size: 1.5rem; }

.kpi-label {
  font-size: 0.85rem;
  color: var(--text-secondary);
  font-weight: 500;
}

.kpi-value {
  font-size: 2rem;
  font-weight: 700;
  margin-bottom: 0.25rem;
  font-variant-numeric: tabular-nums;
  animation: fadeInUp 0.5s ease forwards;
}

.kpi-trend {
  font-size: 0.8rem;
  font-weight: 600;
  display: inline-flex;
  align-items: center;
  gap: 0.25rem;
  padding: 0.15rem 0.5rem;
  border-radius: 6px;
}

.kpi-trend.up  { color: var(--success); background: var(--success-bg); }
.kpi-trend.down { color: var(--danger);  background: var(--danger-bg); }

/* ── Charts Grid ── */
.charts-grid {
  display: grid;
  grid-template-columns: 1fr 1fr;
  gap: 1.5rem;
  margin-bottom: 2rem;
}

@media (max-width: 768px) {
  .charts-grid { grid-template-columns: 1fr; }
}

.chart-card {
  background: var(--bg-card);
  border: 1px solid var(--border);
  border-radius: 16px;
  padding: 1.5rem;
  box-shadow: var(--shadow-sm);
}

.chart-card h3 {
  font-size: 1rem;
  font-weight: 600;
  margin-bottom: 1rem;
  color: var(--text-primary);
}

/* ── Deals Table ── */
.deals-card {
  background: var(--bg-card);
  border: 1px solid var(--border);
  border-radius: 16px;
  padding: 1.5rem;
  box-shadow: var(--shadow-sm);
  margin-bottom: 2rem;
}

.deals-card h3 {
  font-size: 1rem;
  font-weight: 600;
  margin-bottom: 1rem;
}

.deals-table {
  width: 100%;
  border-collapse: collapse;
}

.deals-table th {
  text-align: left;
  font-size: 0.75rem;
  font-weight: 600;
  color: var(--text-muted);
  text-transform: uppercase;
  letter-spacing: 0.05em;
  padding: 0.75rem 1rem;
  border-bottom: 2px solid var(--border);
}

.deals-table td {
  padding: 0.75rem 1rem;
  font-size: 0.9rem;
  border-bottom: 1px solid var(--border);
  transition: background 0.15s ease;
}

.deals-table tr:hover td { background: var(--bg-card-hover); }

.deals-table .company {
  color: var(--text-secondary);
  font-size: 0.8rem;
}

.stage-badge {
  display: inline-block;
  padding: 0.2rem 0.6rem;
  border-radius: 6px;
  font-size: 0.75rem;
  font-weight: 600;
}

.stage-badge.discovery   { background: var(--accent-light); color: var(--accent); }
.stage-badge.proposal    { background: var(--warning-bg);   color: var(--warning); }
.stage-badge.negotiation { background: var(--success-bg);   color: var(--success); }
.stage-badge.closing     { background: var(--danger-bg);    color: var(--danger); }

.prob-bar-bg {
  width: 60px;
  height: 6px;
  background: var(--border);
  border-radius: 3px;
  overflow: hidden;
  display: inline-block;
  vertical-align: middle;
  margin-right: 0.5rem;
}

.prob-bar {
  height: 100%;
  border-radius: 3px;
  background: var(--accent);
  transition: width 0.6s ease;
}

/* ── Toast ── */
.toast {
  position: fixed;
  bottom: 2rem;
  right: 2rem;
  background: var(--accent);
  color: white;
  padding: 0.75rem 1.25rem;
  border-radius: 12px;
  font-size: 0.85rem;
  font-weight: 500;
  box-shadow: var(--shadow-lg);
  opacity: 0;
  transform: translateY(10px);
  transition: all 0.3s ease;
  pointer-events: none;
  z-index: 100;
}

.toast.visible {
  opacity: 1;
  transform: translateY(0);
}

/* ── Animations ── */
@keyframes fadeInUp {
  from { opacity: 0; transform: translateY(8px); }
  to   { opacity: 1; transform: translateY(0); }
}

/* ── KPI Expanded detail ── */
.kpi-detail {
  margin-top: 1rem;
  padding-top: 1rem;
  border-top: 1px solid var(--border);
  animation: fadeInUp 0.3s ease;
}

.kpi-detail-row {
  display: flex;
  justify-content: space-between;
  font-size: 0.85rem;
  padding: 0.25rem 0;
}

.kpi-detail-row span:first-child { color: var(--text-secondary); }
.kpi-detail-row span:last-child  { font-weight: 600; }

/* ── Footer ── */
.footer {
  text-align: center;
  font-size: 0.75rem;
  color: var(--text-muted);
  padding: 1rem 0;
}
The CSS variables defined in :root are the fallback values (light theme). applyTheme() overrides them at runtime on the <html> element: this takes priority over :root, so the dark theme applies instantly.
Step 7: Deploy
Build and push to Power Platform:
npm run build
pac code push
The CLI outputs a Power Apps URL. Open it: your interactive dashboard is live, running inside Power Platform with full Entra ID SSO.
To include it in a managed solution for ALM:
pac code push --solutionName ExecutiveDashboard
Troubleshooting
pac code push fails with auth error
Run pac auth list to check your active profile. If it's empty, run pac auth create and follow the browser login flow.
Assets 404 after deployment (blank page or broken layout)
Verify vite.config.ts has base: './'. If you use the standard Vite template, this is not set by default. Without it, Vite generates absolute paths (/assets/...) that break on the Power Platform CDN.
"You don't have permission to access this app" Your environment may lack the required licence. Code Apps require Power Apps Premium or the Developer Plan. Check Admin Center > Environments > Licences.
App feature not found in PAC CLI
Ensure PAC CLI is up to date: pac install latest. Code Apps require PAC CLI version 1.30 or higher.
The result
You should see:
- A polished dashboard with 4 animated KPI cards
- Interactive filters that re-animate all values on change
- Two responsive charts (area + bar)
- A deals table with color-coded stage badges
- A dark/light toggle in the top-right corner
- Toast notifications on filter changes
- Full Entra ID SSO: no login prompt
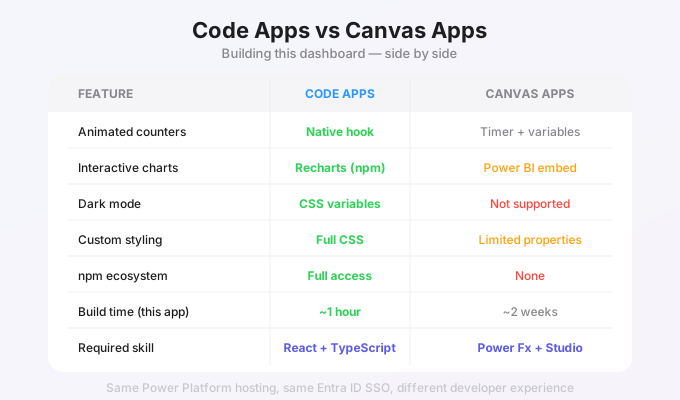
This is something that would take weeks to approximate in Canvas Apps, with significant UX compromises. With Code Apps, it is a standard React project with the full npm ecosystem available.
What's next
You now have a production-quality Code App. Here is what to explore next:
- Connect to Dataverse: replace sample data with
pac code add-data-sourceand live connector calls - Install Fluent UI v9:
npm install @fluentui/react-componentsfor Microsoft's design system - Add more npm packages: Zustand for state, TanStack Query for caching, Motion for animations
- Set up Connection References: for proper ALM across Dev/QA/Prod environments
- Configure CSP: if your app calls external APIs (mandatory since January 30, 2026)
For the full picture, read:
The Complete Guide to Power Apps Code Apps
Sources
- Quickstart: Create a Code App from Scratch - Microsoft Learn
- PAC CLI Code Reference - Microsoft Learn
- microsoft/PowerAppsCodeApps - GitHub (official templates)
- Recharts - composable chart library for React