Power Apps
Premiers pas avec les Code Apps : créer un dashboard interactif
Un tutoriel étape par étape pour construire et déployer un dashboard KPI interactif en tant que Power Apps Code App avec React, TypeScript et Recharts.
Ce tutoriel est entièrement pratique. À la fin, vous aurez un dashboard exécutif complètement interactif tournant dans Power Platform, avec des compteurs animés, des graphiques, des filtres et un mode sombre. Aucune expérience préalable avec les Code Apps n'est requise, seulement les bases de React/TypeScript et un environnement Power Platform.
Ce que vous allez construire
Un dashboard KPI exécutif avec :
- 4 cartes KPI animées qui comptent à l'affichage et se ré-animent quand les filtres changent
- Filtres de période (7 jours / 30 jours / 90 jours / 1 an)
- Filtres de région (All / Europe / Americas / Asia-Pacific)
- Graphique de tendance revenue (area chart) et Pipeline par étape (bar chart)
- Table Top deals avec badges de statut et barres de probabilité
- Toggle Dark/Light mode avec transitions fluides
- Notifications toast à chaque changement de filtre
Le tout en client-side avec des données embarquées : aucune configuration de connector requise.
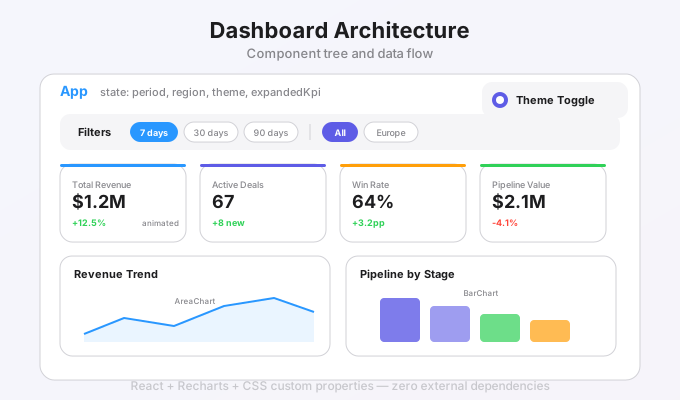
Essayez en live
Voici l'application réelle ci-dessous, cliquez sur les filtres, basculez le mode sombre, agrandissez les cartes KPI :
La démonstration interactive n’est pas exécutée dans cet article. L’explication et le code d’origine sont conservés ci-dessous.
Ouvrir la démonstration du tableau de bord — données fictives uniquement ; aucun compte ni connexion externe.
Prérequis
Avant de commencer, assurez-vous d'avoir :
- Node.js LTS installé (nodejs.org)
- Visual Studio Code ou tout autre éditeur
- Power Platform CLI (
pac) : instructions d'installation - Un environnement Power Platform avec les Code Apps activées
- Une session PAC CLI authentifiée (
pac auth create)
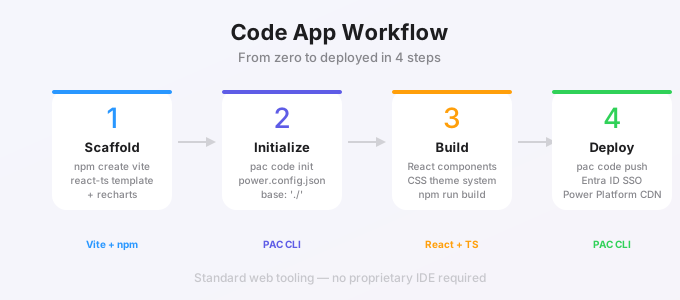
Étape 1 : Scaffolder le projet
Créez un projet Vite + React + TypeScript et installez Recharts pour les graphiques :
npm create vite@latest code-app-dashboard -- --template react-ts
cd code-app-dashboard
npm install
npm install recharts
Étape 2 : Initialiser la Code App
Enregistrez le projet comme Power Apps Code App :
pac code init \
  --displayName "Executive Dashboard" \
  --description "Interactive KPI Dashboard built with React"
Cela crée power.config.json : le fichier de métadonnées qui lie votre projet à Power Platform.
Remplacez le contenu de vite.config.ts par :
// vite.config.ts
import { defineConfig } from 'vite'
import react from '@vitejs/plugin-react'

export default defineConfig({
  plugins: [react()],
  base: './',
})
Étape 3 : Mettre en place le système de thème
Créez src/theme.ts. Ce fichier définit des jeux de tokens light et dark sous forme d'objets JavaScript, puis les applique comme CSS custom properties sur le document root. Quand le thème bascule, tous les composants qui utilisent var(--accent), var(--bg-card), etc. transitionnent automatiquement, sans librairie CSS-in-JS.
// src/theme.ts
export const lightTheme: Record<string, string> = {
  '--bg-primary': '#f8f9fc',
  '--bg-card': '#ffffff',
  '--bg-card-hover': '#f3f0ff',
  '--text-primary': '#1a1a2e',
  '--text-secondary': '#6b7280',
  '--text-muted': '#9ca3af',
  '--border': '#e5e7eb',
  '--accent': '#7c3aed',
  '--accent-light': '#ede9fe',
  '--accent-gradient': 'linear-gradient(135deg, #7c3aed 0%, #a78bfa 100%)',
  '--success': '#10b981',
  '--success-bg': '#ecfdf5',
  '--warning': '#f59e0b',
  '--warning-bg': '#fffbeb',
  '--danger': '#ef4444',
  '--danger-bg': '#fef2f2',
  '--shadow-sm': '0 1px 3px rgba(0,0,0,0.08)',
  '--shadow-md': '0 4px 12px rgba(0,0,0,0.08)',
  '--shadow-lg': '0 8px 30px rgba(0,0,0,0.1)',
};

export const darkTheme: Record<string, string> = {
  '--bg-primary': '#0f0f1a',
  '--bg-card': '#1a1a2e',
  '--bg-card-hover': '#252540',
  '--text-primary': '#e5e7eb',
  '--text-secondary': '#9ca3af',
  '--text-muted': '#6b7280',
  '--border': '#2d2d44',
  '--accent': '#a78bfa',
  '--accent-light': '#1e1b3a',
  '--accent-gradient': 'linear-gradient(135deg, #7c3aed 0%, #a78bfa 100%)',
  '--success': '#34d399',
  '--success-bg': '#0a2e1f',
  '--warning': '#fbbf24',
  '--warning-bg': '#2e2205',
  '--danger': '#f87171',
  '--danger-bg': '#2e0a0a',
  '--shadow-sm': '0 1px 3px rgba(0,0,0,0.3)',
  '--shadow-md': '0 4px 12px rgba(0,0,0,0.3)',
  '--shadow-lg': '0 8px 30px rgba(0,0,0,0.4)',
};

export function applyTheme(theme: Record<string, string>) {
  const root = document.documentElement;
  Object.entries(theme).forEach(([key, value]) => {
    root.style.setProperty(key, value);
  });
}
Étape 4 : Créer le module de données
Créez src/data.ts. Voici le fichier complet : chaque valeur est indexée par [region][period] pour qu'un changement de filtre donne immédiatement le bon chiffre. Les fonctions génératrices de graphiques appliquent un multiplicateur régional aux données de base.
Dans une vraie application, c'est ici qu'on appellerait Dataverse. Pour ce tutoriel, les données embarquées gardent les choses simples et sans dépendance supplémentaire.
// src/data.ts
export interface KPI {
  id: string;
  label: string;
  icon: string;
  format: 'currency' | 'number' | 'percent';
  trend: 'up' | 'down';
  trendLabel: string;
  values: Record<string, Record<string, number>>;
}

export interface DealRow {
  name: string;
  company: string;
  value: number;
  stage: string;
  region: string;
  probability: number;
}

export interface ChartPoint {
  name: string;
  value: number;
}

export type Period = '7d' | '30d' | '90d' | '1y';
export type Region = 'all' | 'europe' | 'americas' | 'asia';

export const PERIODS: { key: Period; label: string }[] = [
  { key: '7d', label: '7 days' },
  { key: '30d', label: '30 days' },
  { key: '90d', label: '90 days' },
  { key: '1y', label: '1 year' },
];

export const REGIONS: { key: Region; label: string }[] = [
  { key: 'all', label: 'All Regions' },
  { key: 'europe', label: 'Europe' },
  { key: 'americas', label: 'Americas' },
  { key: 'asia', label: 'Asia-Pacific' },
];

export const KPI_DATA: KPI[] = [
  {
    id: 'revenue',
    label: 'Total Revenue',
    icon: '\u{1F4B0}',
    format: 'currency',
    trend: 'up',
    trendLabel: '+12.5%',
    values: {
      all:      { '7d': 284000, '30d': 1240000, '90d': 3820000, '1y': 15400000 },
      europe:   { '7d': 112000, '30d': 496000, '90d': 1528000, '1y': 6160000 },
      americas: { '7d': 125000, '30d': 546000, '90d': 1681000, '1y': 6776000 },
      asia:     { '7d': 47000, '30d': 198000, '90d': 611000, '1y': 2464000 },
    },
  },
  {
    id: 'deals',
    label: 'Active Deals',
    icon: '\u{1F4C8}',
    format: 'number',
    trend: 'up',
    trendLabel: '+8 new',
    values: {
      all:      { '7d': 24, '30d': 67, '90d': 142, '1y': 389 },
      europe:   { '7d': 9, '30d': 26, '90d': 55, '1y': 152 },
      americas: { '7d': 11, '30d': 30, '90d': 63, '1y': 170 },
      asia:     { '7d': 4, '30d': 11, '90d': 24, '1y': 67 },
    },
  },
  {
    id: 'winrate',
    label: 'Win Rate',
    icon: '\u{1F3AF}',
    format: 'percent',
    trend: 'up',
    trendLabel: '+3.2pp',
    values: {
      all:      { '7d': 68, '30d': 64, '90d': 61, '1y': 58 },
      europe:   { '7d': 72, '30d': 67, '90d': 63, '1y': 60 },
      americas: { '7d': 65, '30d': 62, '90d': 59, '1y': 56 },
      asia:     { '7d': 64, '30d': 60, '90d': 58, '1y': 55 },
    },
  },
  {
    id: 'pipeline',
    label: 'Pipeline Value',
    icon: '\u{1F680}',
    format: 'currency',
    trend: 'down',
    trendLabel: '-4.1%',
    values: {
      all:      { '7d': 520000, '30d': 2100000, '90d': 6400000, '1y': 24800000 },
      europe:   { '7d': 208000, '30d': 840000, '90d': 2560000, '1y': 9920000 },
      americas: { '7d': 228000, '30d': 924000, '90d': 2816000, '1y': 10912000 },
      asia:     { '7d': 84000, '30d': 336000, '90d': 1024000, '1y': 3968000 },
    },
  },
];

export function getRevenueChart(period: Period, region: Region): ChartPoint[] {
  const base: Record<string, ChartPoint[]> = {
    '7d': [
      { name: 'Mon', value: 38000 }, { name: 'Tue', value: 42000 }, { name: 'Wed', value: 35000 },
      { name: 'Thu', value: 48000 }, { name: 'Fri', value: 52000 }, { name: 'Sat', value: 31000 },
      { name: 'Sun', value: 38000 },
    ],
    '30d': [
      { name: 'W1', value: 280000 }, { name: 'W2', value: 310000 },
      { name: 'W3', value: 295000 }, { name: 'W4', value: 355000 },
    ],
    '90d': [
      { name: 'Jan', value: 1100000 }, { name: 'Feb', value: 1280000 }, { name: 'Mar', value: 1440000 },
    ],
    '1y': [
      { name: 'Q1', value: 3200000 }, { name: 'Q2', value: 3600000 },
      { name: 'Q3', value: 4100000 }, { name: 'Q4', value: 4500000 },
    ],
  };
  const multiplier =
    region === 'all' ? 1 :
    region === 'americas' ? 0.44 :
    region === 'europe' ? 0.40 : 0.16;
  return (base[period] || base['30d']).map(p => ({ ...p, value: Math.round(p.value * multiplier) }));
}

export function getPipelineByStage(region: Region): ChartPoint[] {
  const multiplier =
    region === 'all' ? 1 :
    region === 'americas' ? 0.44 :
    region === 'europe' ? 0.40 : 0.16;
  return [
    { name: 'Discovery', value: Math.round(840000 * multiplier) },
    { name: 'Proposal', value: Math.round(620000 * multiplier) },
    { name: 'Negotiation', value: Math.round(380000 * multiplier) },
    { name: 'Closing', value: Math.round(260000 * multiplier) },
  ];
}

export function getTopDeals(region: Region): DealRow[] {
  const deals: DealRow[] = [
    { name: 'Cloud Migration', company: 'Contoso Ltd', value: 450000, stage: 'Negotiation', region: 'europe', probability: 75 },
    { name: 'ERP Upgrade', company: 'Fabrikam Inc', value: 380000, stage: 'Proposal', region: 'americas', probability: 60 },
    { name: 'Data Platform', company: 'Northwind Traders', value: 320000, stage: 'Closing', region: 'europe', probability: 90 },
    { name: 'Security Audit', company: 'Adventure Works', value: 180000, stage: 'Discovery', region: 'americas', probability: 40 },
    { name: 'AI Integration', company: 'Tailspin Toys', value: 520000, stage: 'Proposal', region: 'asia', probability: 55 },
    { name: 'Digital Twin', company: 'Woodgrove Bank', value: 680000, stage: 'Negotiation', region: 'americas', probability: 70 },
    { name: 'IoT Platform', company: 'Litware Inc', value: 290000, stage: 'Closing', region: 'europe', probability: 85 },
    { name: 'Analytics Suite', company: 'Proseware', value: 410000, stage: 'Discovery', region: 'asia', probability: 35 },
  ];
  if (region === 'all') return deals;
  return deals.filter(d => d.region === region);
}
Étape 5 : Construire le dashboard
Créez src/App.tsx. Le fichier complet est présenté ci-dessous pour que vous puissiez le copier directement. Les patterns clés sont expliqués après le bloc de code.
// src/App.tsx
import { useState, useEffect, useCallback, useRef } from 'react';
import {
  BarChart, Bar, AreaChart, Area, XAxis, YAxis, Tooltip, ResponsiveContainer, Cell,
} from 'recharts';
import {
  KPI_DATA, PERIODS, REGIONS, getRevenueChart, getPipelineByStage, getTopDeals,
  type Period, type Region, type KPI,
} from './data';
import { lightTheme, darkTheme, applyTheme } from './theme';
import './styles.css';

/* ── Animated Counter Hook ── */
function useAnimatedValue(target: number, duration = 800) {
  const [value, setValue] = useState(0);
  const rafRef = useRef<number>(0);

  useEffect(() => {
    const start = value;
    const diff = target - start;
    const startTime = performance.now();

    function tick(now: number) {
      const elapsed = now - startTime;
      const progress = Math.min(elapsed / duration, 1);
      const eased = 1 - Math.pow(1 - progress, 3); // easeOutCubic
      setValue(Math.round(start + diff * eased));
      if (progress < 1) rafRef.current = requestAnimationFrame(tick);
    }

    rafRef.current = requestAnimationFrame(tick);
    return () => cancelAnimationFrame(rafRef.current);
    // eslint-disable-next-line react-hooks/exhaustive-deps
  }, [target, duration]);

  return value;
}

/* ── Format Helpers ── */
function formatValue(n: number, format: KPI['format']) {
  if (format === 'currency') {
    if (n >= 1_000_000) return `$${(n / 1_000_000).toFixed(1)}M`;
    if (n >= 1_000) return `$${(n / 1_000).toFixed(0)}K`;
    return `$${n}`;
  }
  if (format === 'percent') return `${n}%`;
  return n.toLocaleString();
}

function formatCurrency(n: number) {
  if (n >= 1_000_000) return `$${(n / 1_000_000).toFixed(1)}M`;
  if (n >= 1_000) return `$${(n / 1_000).toFixed(0)}K`;
  return `$${n}`;
}

/* ── KPI Card Component ── */
function KpiCard({ kpi, period, region, expanded, onToggle }: {
  kpi: KPI; period: Period; region: Region; expanded: boolean; onToggle: () => void;
}) {
  const raw = kpi.values[region]?.[period] ?? kpi.values['all'][period];
  const animated = useAnimatedValue(raw);
  const allPeriods = (['7d', '30d', '90d', '1y'] as Period[]).filter(p => p !== period);

  return (
    <div className={`kpi-card${expanded ? ' expanded' : ''}`} onClick={onToggle}>
      <div className="kpi-header">
        <span className="kpi-label">{kpi.label}</span>
        <span className="kpi-icon">{kpi.icon}</span>
      </div>
      <div className="kpi-value" key={`${region}-${period}`}>
        {formatValue(animated, kpi.format)}
      </div>
      <span className={`kpi-trend ${kpi.trend}`}>
        {kpi.trend === 'up' ? '\u2191' : '\u2193'} {kpi.trendLabel}
      </span>
      {expanded && (
        <div className="kpi-detail">
          {allPeriods.map(p => (
            <div className="kpi-detail-row" key={p}>
              <span>{PERIODS.find(x => x.key === p)?.label}</span>
              <span>{formatValue(kpi.values[region]?.[p] ?? kpi.values['all'][p], kpi.format)}</span>
            </div>
          ))}
        </div>
      )}
    </div>
  );
}

/* ── Custom Tooltip ── */
function ChartTooltip({ active, payload, label }: {
  active?: boolean; payload?: { value: number }[]; label?: string;
}) {
  if (!active || !payload?.length) return null;
  return (
    <div style={{
      background: 'var(--bg-card)', border: '1px solid var(--border)',
      borderRadius: 10, padding: '0.5rem 0.75rem', boxShadow: 'var(--shadow-md)',
    }}>
      <div style={{ fontSize: '0.75rem', color: 'var(--text-muted)' }}>{label}</div>
      <div style={{ fontSize: '0.95rem', fontWeight: 700, color: 'var(--text-primary)' }}>
        {formatCurrency(payload[0].value)}
      </div>
    </div>
  );
}

/* ── Main App ── */
export default function App() {
  const [dark, setDark] = useState(false);
  const [period, setPeriod] = useState<Period>('30d');
  const [region, setRegion] = useState<Region>('all');
  const [expandedKpi, setExpandedKpi] = useState<string | null>(null);
  const [toast, setToast] = useState<string | null>(null);

  useEffect(() => {
    applyTheme(dark ? darkTheme : lightTheme);
  }, [dark]);

  const showToast = useCallback((msg: string) => {
    setToast(msg);
    setTimeout(() => setToast(null), 2000);
  }, []);

  const handlePeriod = (p: Period) => {
    setPeriod(p);
    showToast(`Showing ${PERIODS.find(x => x.key === p)?.label} data`);
  };

  const handleRegion = (r: Region) => {
    setRegion(r);
    showToast(`Filtered: ${REGIONS.find(x => x.key === r)?.label}`);
  };

  const revenueData = getRevenueChart(period, region);
  const pipelineData = getPipelineByStage(region);
  const deals = getTopDeals(region);
  const barColors = ['#7c3aed', '#a78bfa', '#10b981', '#f59e0b'];

  return (
    <div className="dashboard">
      {/* Header */}
      <div className="header">
        <h1>Executive Dashboard</h1>
        <div className="header-actions">
          <button
            className={`theme-toggle${dark ? ' dark' : ''}`}
            onClick={() => setDark(d => !d)}
            title={dark ? 'Switch to light mode' : 'Switch to dark mode'}
            aria-label="Toggle theme"
          />
        </div>
      </div>

      {/* Period + Region Filters */}
      <div className="filters">
        {PERIODS.map(p => (
          <button
            key={p.key}
            className={`pill${period === p.key ? ' active' : ''}`}
            onClick={() => handlePeriod(p.key)}
          >
            {p.label}
          </button>
        ))}
        <span style={{ width: 1, background: 'var(--border)', margin: '0 0.25rem' }} />
        {REGIONS.map(r => (
          <button
            key={r.key}
            className={`pill${region === r.key ? ' active' : ''}`}
            onClick={() => handleRegion(r.key)}
          >
            {r.label}
          </button>
        ))}
      </div>

      {/* KPI Cards */}
      <div className="kpi-grid">
        {KPI_DATA.map(kpi => (
          <KpiCard
            key={kpi.id}
            kpi={kpi}
            period={period}
            region={region}
            expanded={expandedKpi === kpi.id}
            onToggle={() => setExpandedKpi(prev => prev === kpi.id ? null : kpi.id)}
          />
        ))}
      </div>

      {/* Charts */}
      <div className="charts-grid">
        <div className="chart-card">
          <h3>Revenue Trend</h3>
          <ResponsiveContainer width="100%" height={240}>
            <AreaChart data={revenueData}>
              <defs>
                <linearGradient id="areaGrad" x1="0" y1="0" x2="0" y2="1">
                  <stop offset="0%" stopColor="#7c3aed" stopOpacity={0.3} />
                  <stop offset="100%" stopColor="#7c3aed" stopOpacity={0} />
                </linearGradient>
              </defs>
              <XAxis dataKey="name" axisLine={false} tickLine={false}
                tick={{ fill: 'var(--text-muted)', fontSize: 12 }} />
              <YAxis hide />
              <Tooltip content={<ChartTooltip />} />
              <Area type="monotone" dataKey="value" stroke="#7c3aed"
                strokeWidth={2.5} fill="url(#areaGrad)" animationDuration={800} />
            </AreaChart>
          </ResponsiveContainer>
        </div>

        <div className="chart-card">
          <h3>Pipeline by Stage</h3>
          <ResponsiveContainer width="100%" height={240}>
            <BarChart data={pipelineData} barCategoryGap="25%">
              <XAxis dataKey="name" axisLine={false} tickLine={false}
                tick={{ fill: 'var(--text-muted)', fontSize: 12 }} />
              <YAxis hide />
              <Tooltip content={<ChartTooltip />} />
              <Bar dataKey="value" radius={[8, 8, 0, 0]} animationDuration={800}>
                {pipelineData.map((_, i) => (
                  <Cell key={i} fill={barColors[i % barColors.length]} />
                ))}
              </Bar>
            </BarChart>
          </ResponsiveContainer>
        </div>
      </div>

      {/* Deals Table */}
      <div className="deals-card">
        <h3>Top Deals</h3>
        <table className="deals-table">
          <thead>
            <tr>
              <th>Deal</th>
              <th>Value</th>
              <th>Stage</th>
              <th>Probability</th>
            </tr>
          </thead>
          <tbody>
            {deals.map(d => (
              <tr key={d.name}>
                <td>
                  <div style={{ fontWeight: 600 }}>{d.name}</div>
                  <div className="company">{d.company}</div>
                </td>
                <td style={{ fontWeight: 600, fontVariantNumeric: 'tabular-nums' }}>
                  {formatCurrency(d.value)}
                </td>
                <td>
                  <span className={`stage-badge ${d.stage.toLowerCase()}`}>{d.stage}</span>
                </td>
                <td>
                  <span className="prob-bar-bg">
                    <span className="prob-bar" style={{ width: `${d.probability}%` }} />
                  </span>
                  {d.probability}%
                </td>
              </tr>
            ))}
          </tbody>
        </table>
      </div>

      {/* Footer */}
      <div className="footer">
        Built with React + Recharts — Powered by Power Apps Code Apps
      </div>

      {/* Toast */}
      <div className={`toast${toast ? ' visible' : ''}`}>{toast}</div>
    </div>
  );
}
Patterns clés dans le code ci-dessus :
useAnimatedValueest un hook personnalisé qui utiliserequestAnimationFrameavec une fonction d'easing easeOutCubic : il compte de la valeur actuellement affichée vers la nouvelle cible, les changements de filtres s'animent donc en douceur sans reset à zéro.KpiCardest sans état propre : il reçoitexpandedetonToggledu parent. Cliquer une carte la développe pour afficher toutes les valeurs de période pour la région active.ChartTooltiputilise les CSS variables directement dans les propsstyle, il hérite donc automatiquement du thème actif.- Le système toast utilise
setTimeoutpour effacer le message : simple et efficace sans librairie.
Étape 6 : Ajouter les styles
Créez src/styles.css. Voici le fichier complet :
/* ── Reset & Base ── */
*, *::before, *::after { box-sizing: border-box; margin: 0; padding: 0; }

:root {
  --bg-primary: #f8f9fc;
  --bg-card: #ffffff;
  --bg-card-hover: #f3f0ff;
  --text-primary: #1a1a2e;
  --text-secondary: #6b7280;
  --text-muted: #9ca3af;
  --border: #e5e7eb;
  --accent: #7c3aed;
  --accent-light: #ede9fe;
  --accent-gradient: linear-gradient(135deg, #7c3aed 0%, #a78bfa 100%);
  --success: #10b981;
  --success-bg: #ecfdf5;
  --warning: #f59e0b;
  --warning-bg: #fffbeb;
  --danger: #ef4444;
  --danger-bg: #fef2f2;
  --shadow-sm: 0 1px 3px rgba(0,0,0,0.08);
  --shadow-md: 0 4px 12px rgba(0,0,0,0.08);
  --shadow-lg: 0 8px 30px rgba(0,0,0,0.1);
}

body {
  font-family: 'Segoe UI', -apple-system, BlinkMacSystemFont, sans-serif;
  background: var(--bg-primary);
  color: var(--text-primary);
  line-height: 1.5;
  transition: background 0.3s ease, color 0.3s ease;
}

/* ── Layout ── */
.dashboard {
  max-width: 1200px;
  margin: 0 auto;
  padding: 2rem 1.5rem;
}

.header {
  display: flex;
  align-items: center;
  justify-content: space-between;
  margin-bottom: 2rem;
  flex-wrap: wrap;
  gap: 1rem;
}

.header h1 {
  font-size: 1.75rem;
  font-weight: 700;
  background: var(--accent-gradient);
  -webkit-background-clip: text;
  -webkit-text-fill-color: transparent;
  background-clip: text;
}

.header-actions {
  display: flex;
  align-items: center;
  gap: 0.75rem;
}

/* ── Toggle Button ── */
.theme-toggle {
  width: 44px;
  height: 24px;
  border-radius: 12px;
  border: 2px solid var(--border);
  background: var(--bg-card);
  cursor: pointer;
  position: relative;
  transition: all 0.3s ease;
}

.theme-toggle::after {
  content: '';
  position: absolute;
  width: 16px;
  height: 16px;
  border-radius: 50%;
  background: var(--accent);
  top: 2px;
  left: 2px;
  transition: transform 0.3s ease;
}

.theme-toggle.dark::after {
  transform: translateX(20px);
}

/* ── Filter Pills ── */
.filters {
  display: flex;
  gap: 0.5rem;
  flex-wrap: wrap;
  margin-bottom: 1.5rem;
}

.pill {
  padding: 0.5rem 1rem;
  border-radius: 9999px;
  border: 1.5px solid var(--border);
  background: var(--bg-card);
  color: var(--text-secondary);
  font-size: 0.85rem;
  font-weight: 500;
  cursor: pointer;
  transition: all 0.2s ease;
  user-select: none;
}

.pill:hover {
  border-color: var(--accent);
  color: var(--accent);
}

.pill.active {
  background: var(--accent);
  border-color: var(--accent);
  color: white;
}

/* ── KPI Cards ── */
.kpi-grid {
  display: grid;
  grid-template-columns: repeat(auto-fit, minmax(240px, 1fr));
  gap: 1rem;
  margin-bottom: 2rem;
}

.kpi-card {
  background: var(--bg-card);
  border: 1px solid var(--border);
  border-radius: 16px;
  padding: 1.5rem;
  box-shadow: var(--shadow-sm);
  cursor: pointer;
  transition: all 0.3s ease;
  position: relative;
  overflow: hidden;
}

.kpi-card::before {
  content: '';
  position: absolute;
  top: 0;
  left: 0;
  right: 0;
  height: 3px;
  background: var(--accent-gradient);
  opacity: 0;
  transition: opacity 0.3s ease;
}

.kpi-card:hover {
  transform: translateY(-2px);
  box-shadow: var(--shadow-md);
  border-color: var(--accent);
}

.kpi-card:hover::before { opacity: 1; }

.kpi-card.expanded {
  grid-column: 1 / -1;
}

.kpi-header {
  display: flex;
  align-items: center;
  justify-content: space-between;
  margin-bottom: 0.75rem;
}

.kpi-icon { font-size: 1.5rem; }

.kpi-label {
  font-size: 0.85rem;
  color: var(--text-secondary);
  font-weight: 500;
}

.kpi-value {
  font-size: 2rem;
  font-weight: 700;
  margin-bottom: 0.25rem;
  font-variant-numeric: tabular-nums;
  animation: fadeInUp 0.5s ease forwards;
}

.kpi-trend {
  font-size: 0.8rem;
  font-weight: 600;
  display: inline-flex;
  align-items: center;
  gap: 0.25rem;
  padding: 0.15rem 0.5rem;
  border-radius: 6px;
}

.kpi-trend.up  { color: var(--success); background: var(--success-bg); }
.kpi-trend.down { color: var(--danger);  background: var(--danger-bg); }

/* ── Charts Grid ── */
.charts-grid {
  display: grid;
  grid-template-columns: 1fr 1fr;
  gap: 1.5rem;
  margin-bottom: 2rem;
}

@media (max-width: 768px) {
  .charts-grid { grid-template-columns: 1fr; }
}

.chart-card {
  background: var(--bg-card);
  border: 1px solid var(--border);
  border-radius: 16px;
  padding: 1.5rem;
  box-shadow: var(--shadow-sm);
}

.chart-card h3 {
  font-size: 1rem;
  font-weight: 600;
  margin-bottom: 1rem;
  color: var(--text-primary);
}

/* ── Deals Table ── */
.deals-card {
  background: var(--bg-card);
  border: 1px solid var(--border);
  border-radius: 16px;
  padding: 1.5rem;
  box-shadow: var(--shadow-sm);
  margin-bottom: 2rem;
}

.deals-card h3 {
  font-size: 1rem;
  font-weight: 600;
  margin-bottom: 1rem;
}

.deals-table {
  width: 100%;
  border-collapse: collapse;
}

.deals-table th {
  text-align: left;
  font-size: 0.75rem;
  font-weight: 600;
  color: var(--text-muted);
  text-transform: uppercase;
  letter-spacing: 0.05em;
  padding: 0.75rem 1rem;
  border-bottom: 2px solid var(--border);
}

.deals-table td {
  padding: 0.75rem 1rem;
  font-size: 0.9rem;
  border-bottom: 1px solid var(--border);
  transition: background 0.15s ease;
}

.deals-table tr:hover td { background: var(--bg-card-hover); }

.deals-table .company {
  color: var(--text-secondary);
  font-size: 0.8rem;
}

.stage-badge {
  display: inline-block;
  padding: 0.2rem 0.6rem;
  border-radius: 6px;
  font-size: 0.75rem;
  font-weight: 600;
}

.stage-badge.discovery   { background: var(--accent-light); color: var(--accent); }
.stage-badge.proposal    { background: var(--warning-bg);   color: var(--warning); }
.stage-badge.negotiation { background: var(--success-bg);   color: var(--success); }
.stage-badge.closing     { background: var(--danger-bg);    color: var(--danger); }

.prob-bar-bg {
  width: 60px;
  height: 6px;
  background: var(--border);
  border-radius: 3px;
  overflow: hidden;
  display: inline-block;
  vertical-align: middle;
  margin-right: 0.5rem;
}

.prob-bar {
  height: 100%;
  border-radius: 3px;
  background: var(--accent);
  transition: width 0.6s ease;
}

/* ── Toast ── */
.toast {
  position: fixed;
  bottom: 2rem;
  right: 2rem;
  background: var(--accent);
  color: white;
  padding: 0.75rem 1.25rem;
  border-radius: 12px;
  font-size: 0.85rem;
  font-weight: 500;
  box-shadow: var(--shadow-lg);
  opacity: 0;
  transform: translateY(10px);
  transition: all 0.3s ease;
  pointer-events: none;
  z-index: 100;
}

.toast.visible {
  opacity: 1;
  transform: translateY(0);
}

/* ── Animations ── */
@keyframes fadeInUp {
  from { opacity: 0; transform: translateY(8px); }
  to   { opacity: 1; transform: translateY(0); }
}

/* ── KPI Expanded detail ── */
.kpi-detail {
  margin-top: 1rem;
  padding-top: 1rem;
  border-top: 1px solid var(--border);
  animation: fadeInUp 0.3s ease;
}

.kpi-detail-row {
  display: flex;
  justify-content: space-between;
  font-size: 0.85rem;
  padding: 0.25rem 0;
}

.kpi-detail-row span:first-child { color: var(--text-secondary); }
.kpi-detail-row span:last-child  { font-weight: 600; }

/* ── Footer ── */
.footer {
  text-align: center;
  font-size: 0.75rem;
  color: var(--text-muted);
  padding: 1rem 0;
}
Les variables CSS définies dans :root sont les valeurs de fallback (theme light). applyTheme() les surcharge au runtime sur l'élément <html> : ce qui prend la priorité sur :root, le theme dark s'applique donc instantanément.
Étape 7 : Déployer
Compilez et poussez vers Power Platform :
npm run build
pac code push
Le CLI affiche une URL Power Apps. Ouvrez-la : votre dashboard interactif est en ligne, tournant dans Power Platform avec le SSO Entra ID complet.
Pour l'inclure dans une solution gérée pour l'ALM :
pac code push --solutionName ExecutiveDashboard
Dépannage
pac code push échoue avec une erreur d'authentification
Lancez pac auth list pour vérifier votre profil actif. S'il est vide, lancez pac auth create et suivez la connexion navigateur.
Assets 404 après déploiement (page blanche ou mise en page cassée)
Vérifiez que vite.config.ts contient base: './'. Sans cela, Vite génère des chemins absolus (/assets/...) qui ne fonctionnent pas sur le CDN Power Platform.
"You don't have permission to access this app" Votre environnement n'a peut-être pas la licence requise. Les Code Apps nécessitent Power Apps Premium ou le Developer Plan. Vérifiez dans Admin Center > Environments > Licences.
La fonctionnalité pac code est introuvable dans le CLI
Assurez-vous que PAC CLI est à jour : pac install latest. Les Code Apps nécessitent PAC CLI version 1.30 ou supérieure.
Le résultat
Vous devriez voir :
- Un dashboard soigné avec 4 cartes KPI animées
- Des filtres interactifs qui re-animent toutes les valeurs au changement
- Deux graphiques responsifs (area + bar)
- Une table de deals avec des badges de statut colorés
- Un toggle dark/light dans le coin supérieur droit
- Des notifications toast aux changements de filtres
- SSO Entra ID complet : aucune invite de connexion
C'est quelque chose qui prendrait des semaines à approximer en Canvas Apps, avec des compromis UX significatifs. Avec les Code Apps, c'est un projet React standard avec tout l'écosystème npm disponible.
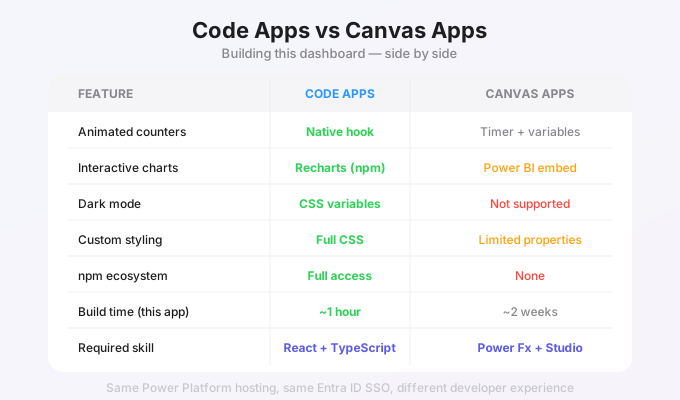
Et ensuite
Vous avez maintenant une Code App de qualité production. Voici ce que vous pouvez explorer ensuite :
- Connecter à Dataverse : remplacer les données sample par
pac code add-data-sourceet des appels connector live - Installer Fluent UI v9 :
npm install @fluentui/react-componentspour le design system Microsoft - Ajouter d'autres packages npm : Zustand pour le state, TanStack Query pour le caching, Motion pour les animations
- Configurer les Connection References : pour un ALM correct entre Dev/QA/Prod
- Configurer le CSP : si votre application appelle des API externes (obligatoire depuis le 30 janvier 2026)
Pour une vue complète, consultez :
Le guide complet des Power Apps Code Apps
Sources
- Quickstart: Create a Code App from Scratch - Microsoft Learn
- PAC CLI Code Reference - Microsoft Learn
- microsoft/PowerAppsCodeApps - GitHub (templates officiels)
- Recharts - librairie de graphiques composables pour React